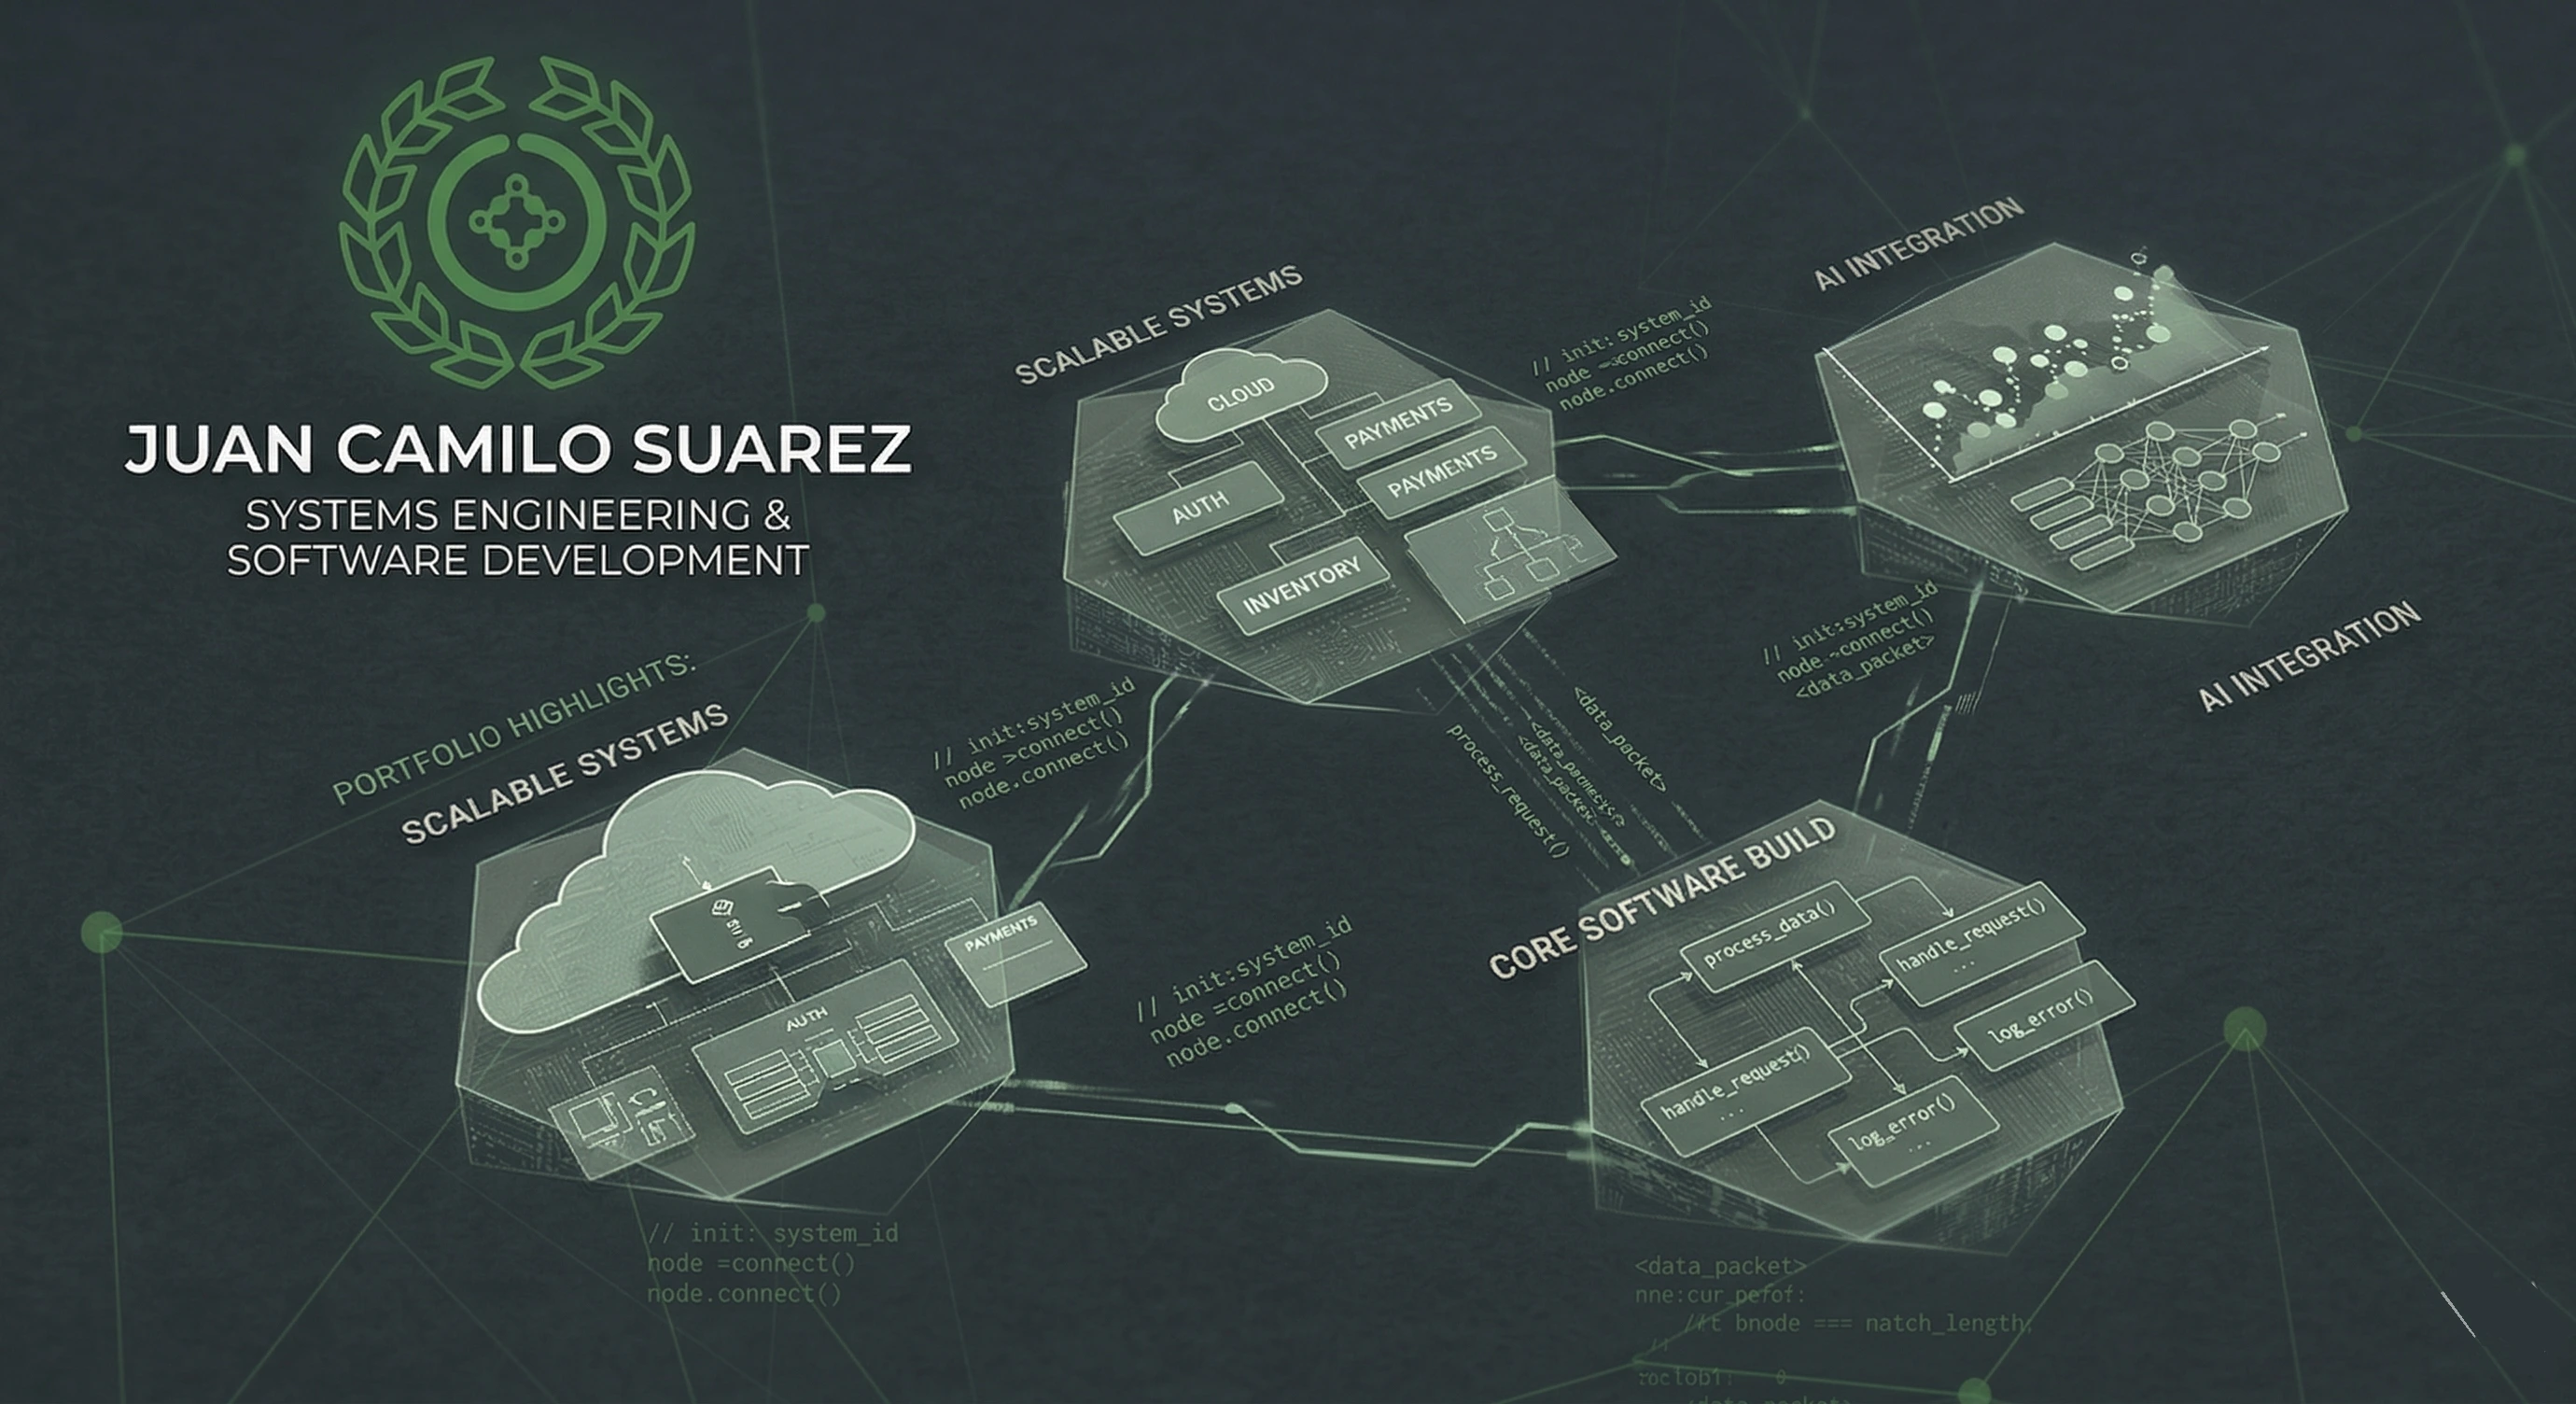
Featured projects
Hi and welcome to my engineering portfolio. Here you will find a collection of my 3 star projects and I am very proud of them. The most important one is Andes Board, which took me 1 year and 6 months to build because it involved IoT sensors. It is a platform that allows companies to know where the gas cylinders that need to be refilled are located. My second star project is about machine learning and I did it with some friends; the goal was to predict the quality of vinho verde. And as a final star project, a load balancer that has automated deployments to the Azure cloud.
If you are interested in a particular project, select the one you want to read in the following index, and it will take you to the section you need.
Project index
Monitor the amount of gas in an LPG cylinder
This project was sponsored by my previous job at Andes Technologies, so the code is their intellectual property. However, I was authorized to present it for my thesis.
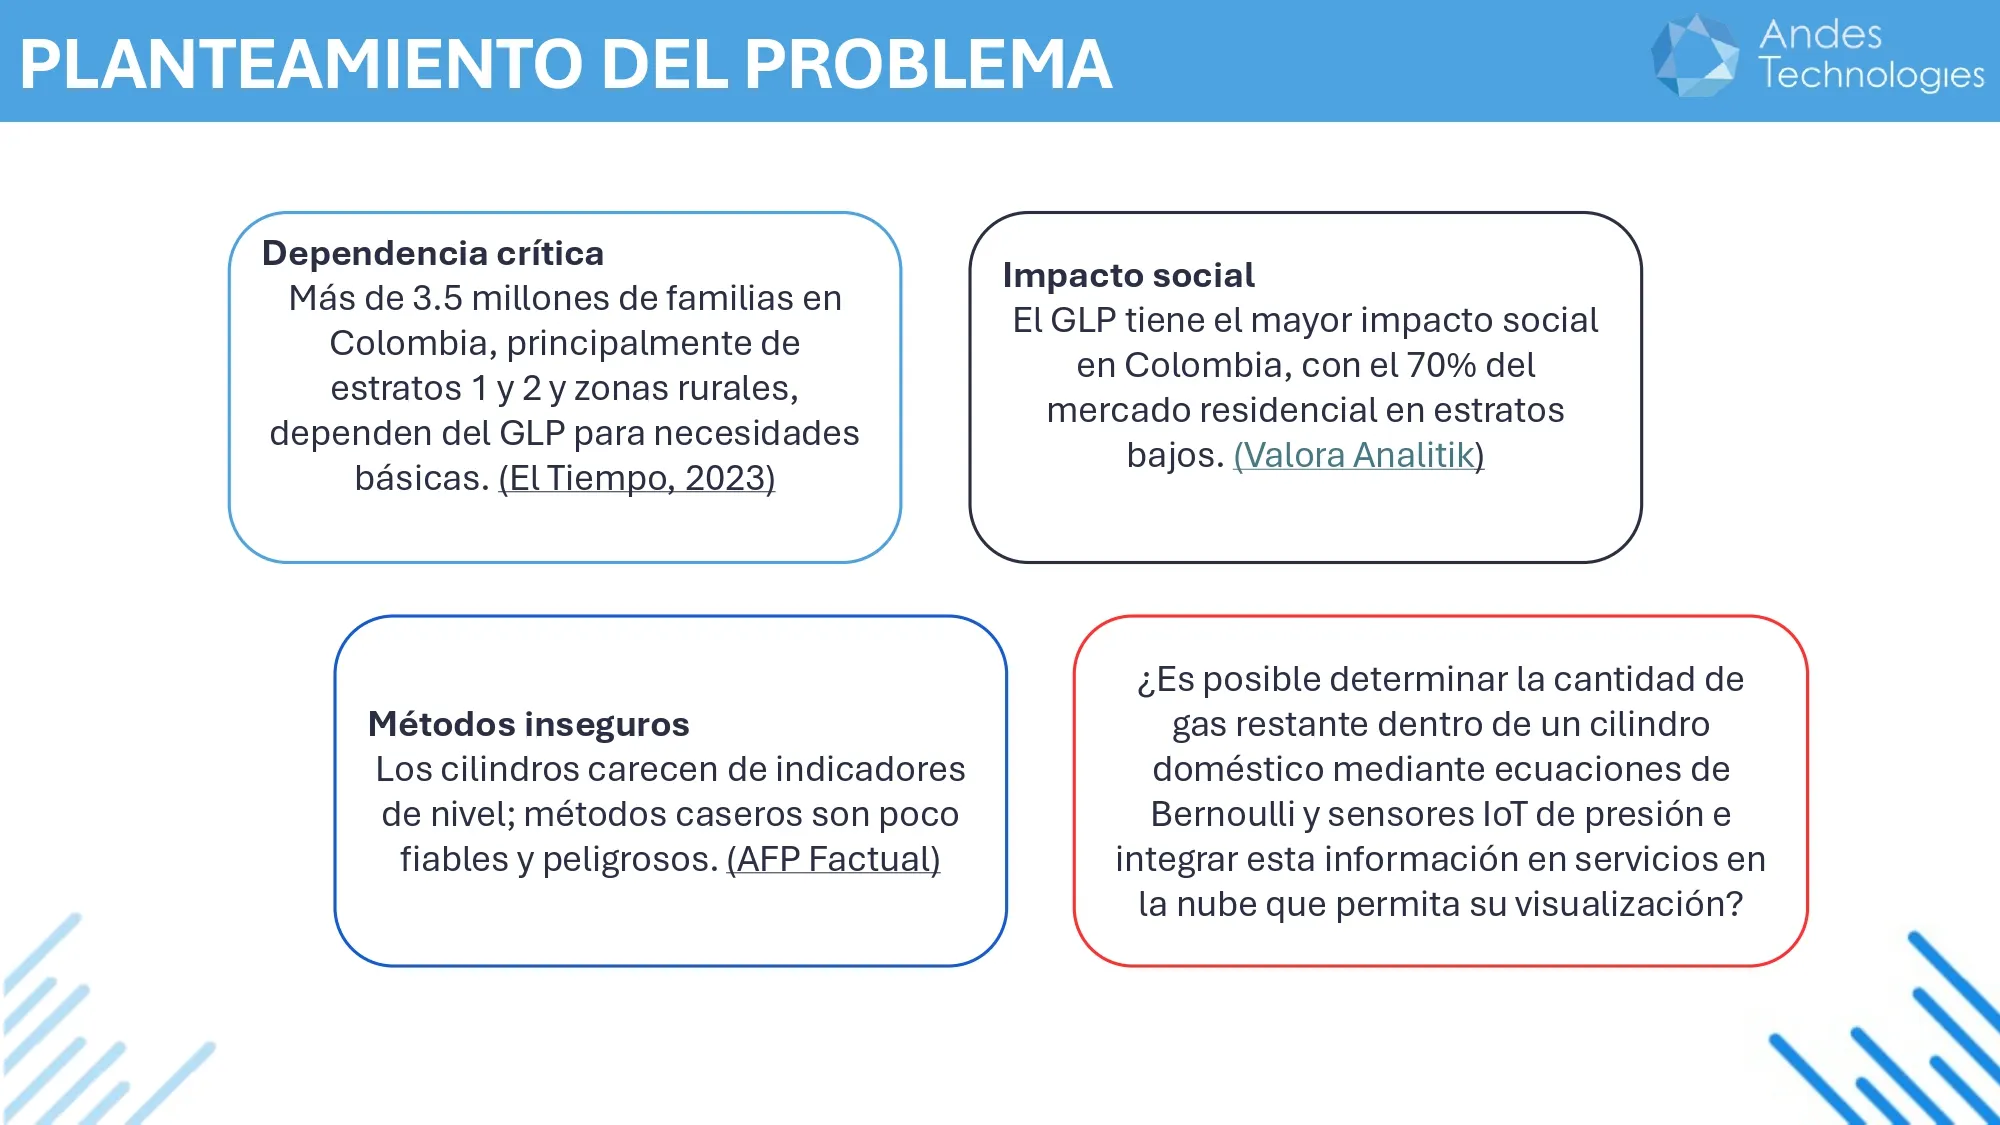
In many homes, gas cylinders are necessary for cooking or other domestic uses. These cylinders usually do not have an indicator that shows how much gas is left. This means that many people find out the gas is gone when the gas pressure drops suddenly and the cylinder stops working. That is why the project started with a simple question:
Is it possible to know how much gas is left inside a cylinder using sensors and some physics calculations?
To answer this question, I developed a web app that combines IoT sensors, physical measurements, and mathematical calculations to determine the remaining gas. The following image summarizes the problem that motivated the project.
Before starting to program and everything else, we designed a research methodology to build and test the calculations under controlled conditions that you will see later.
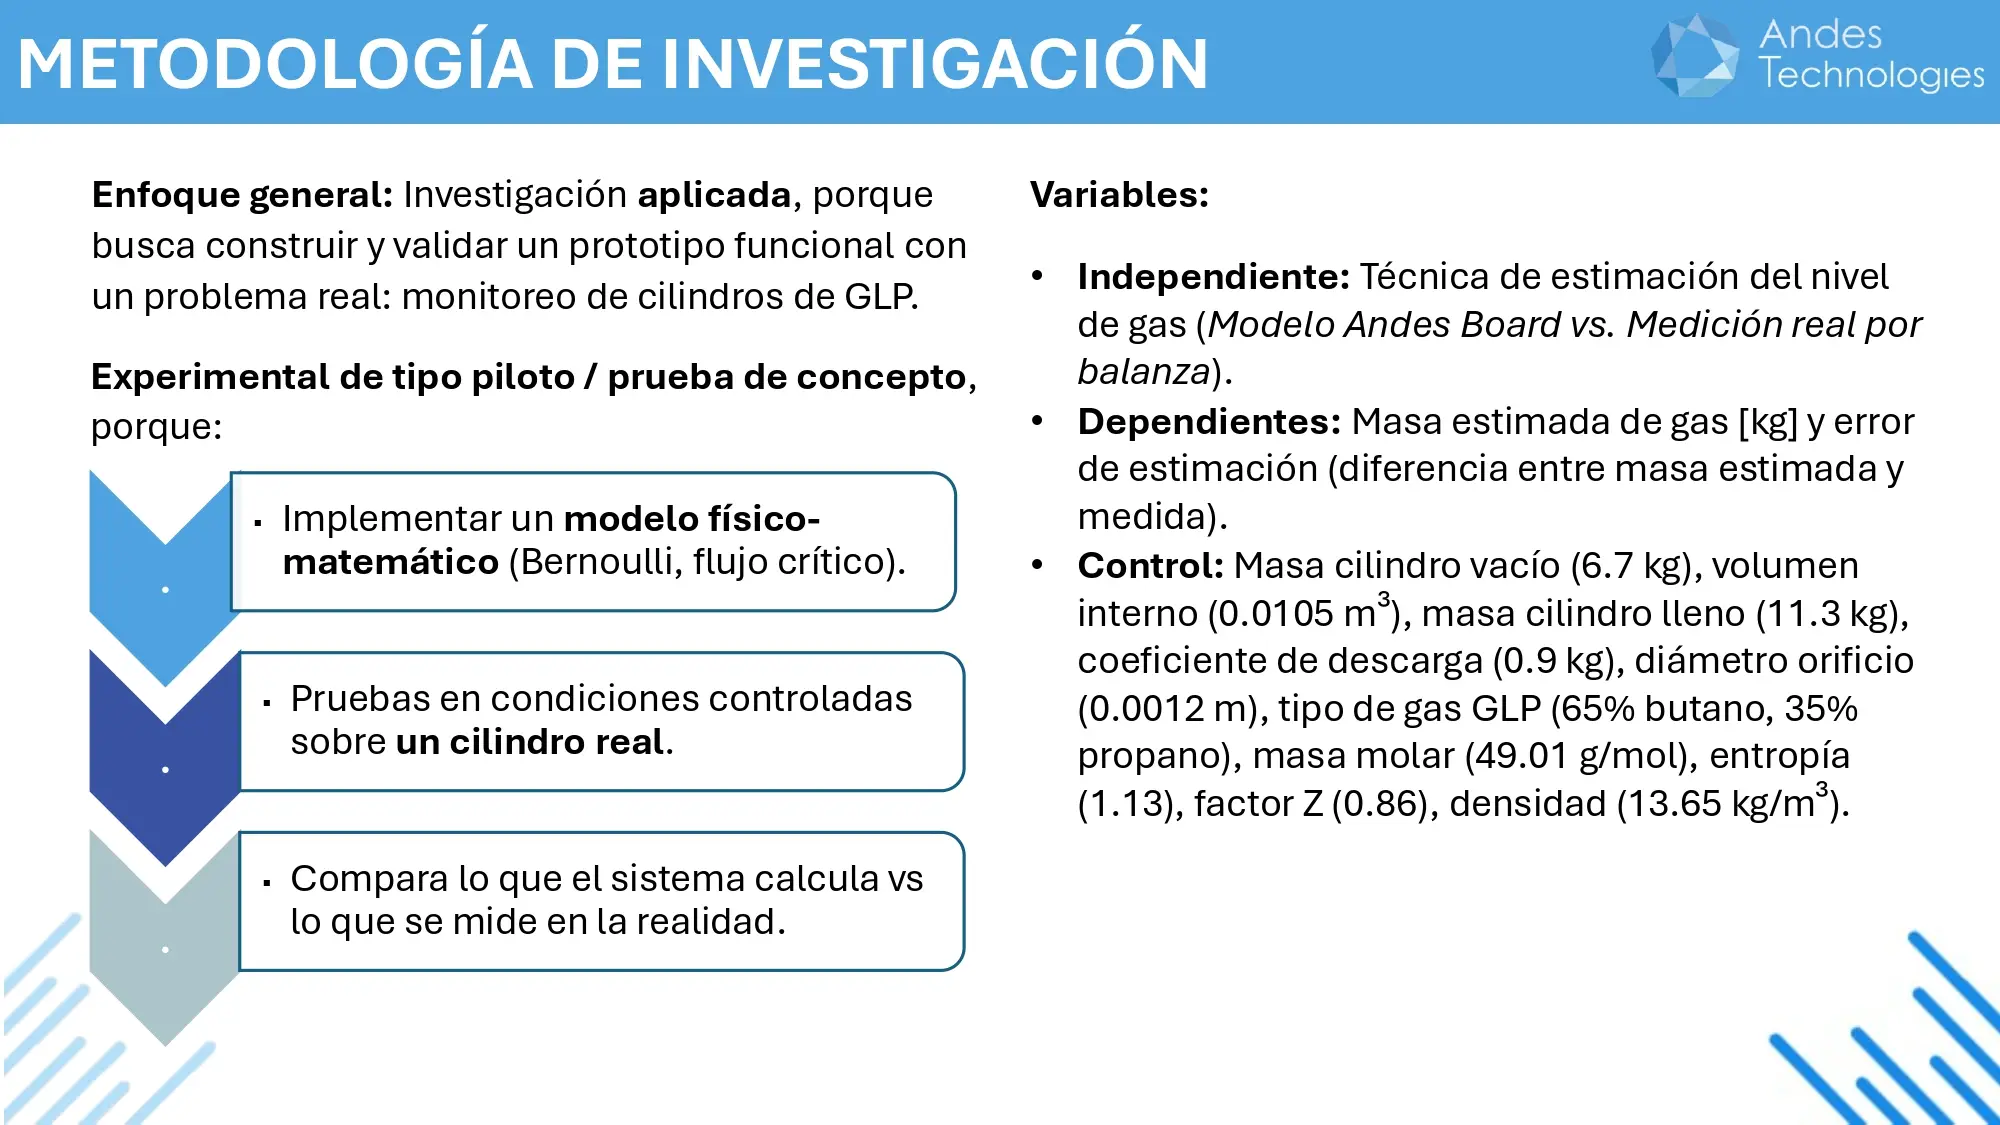
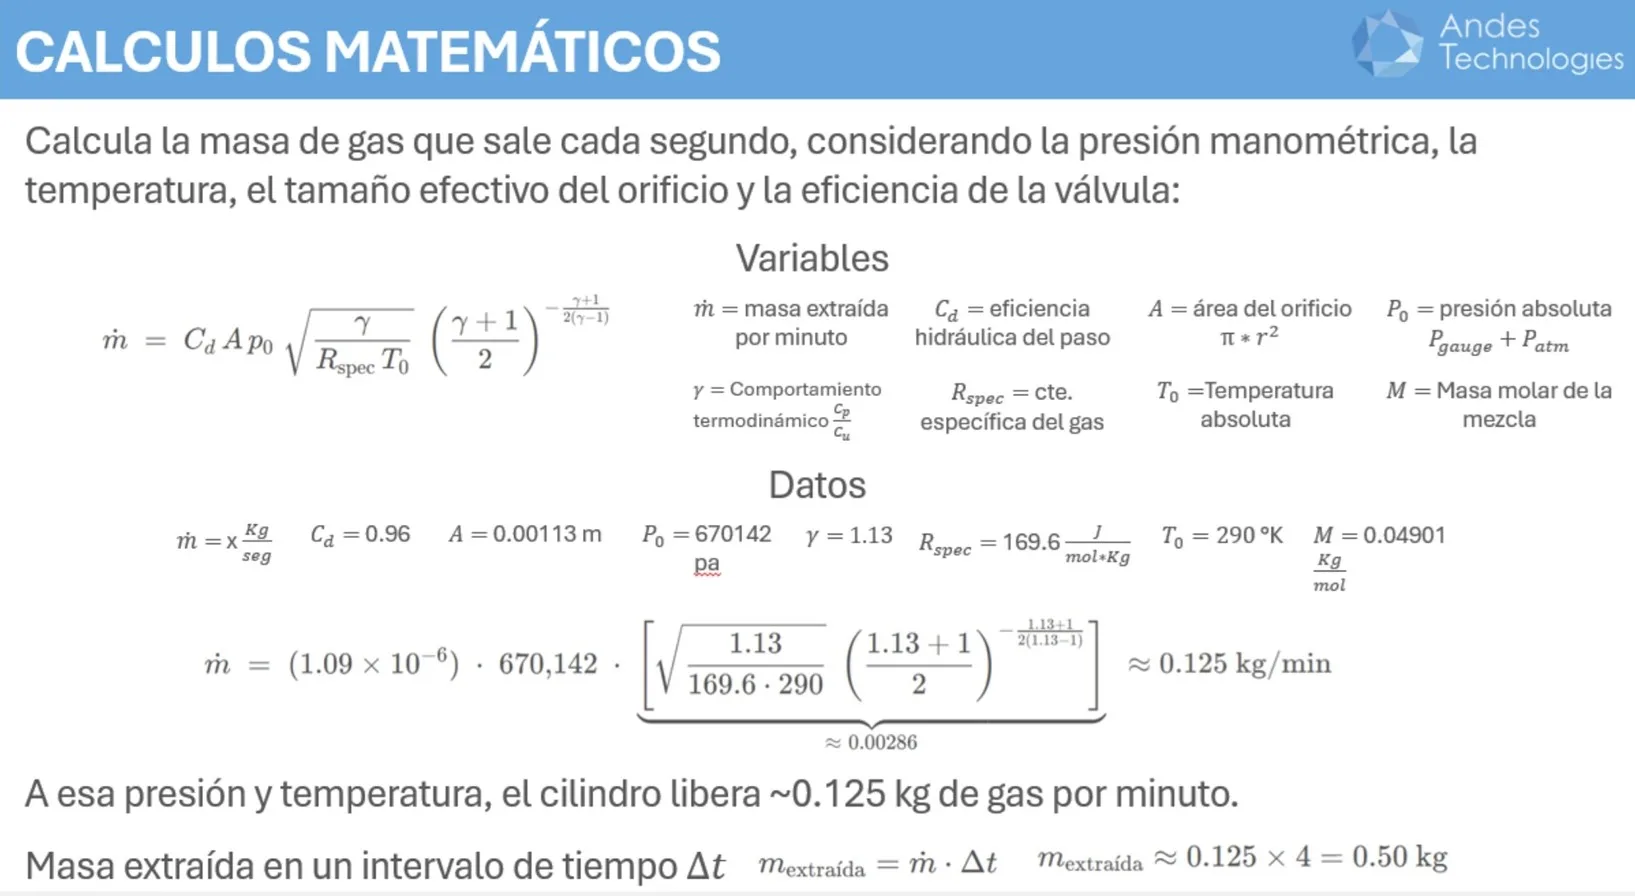
When we performed the research methodology in the scenario where we opened the valve and let the gas escape, we were able to validate that the values calculated by the system were equivalent to the measurements made. But in other scenarios, where the cylinder was connected to a stove, the calculations varied a lot. After many attempts, we arrived at the critical and subcritical flow equations which varied very little in the scenario of the cylinder connected to a stove.
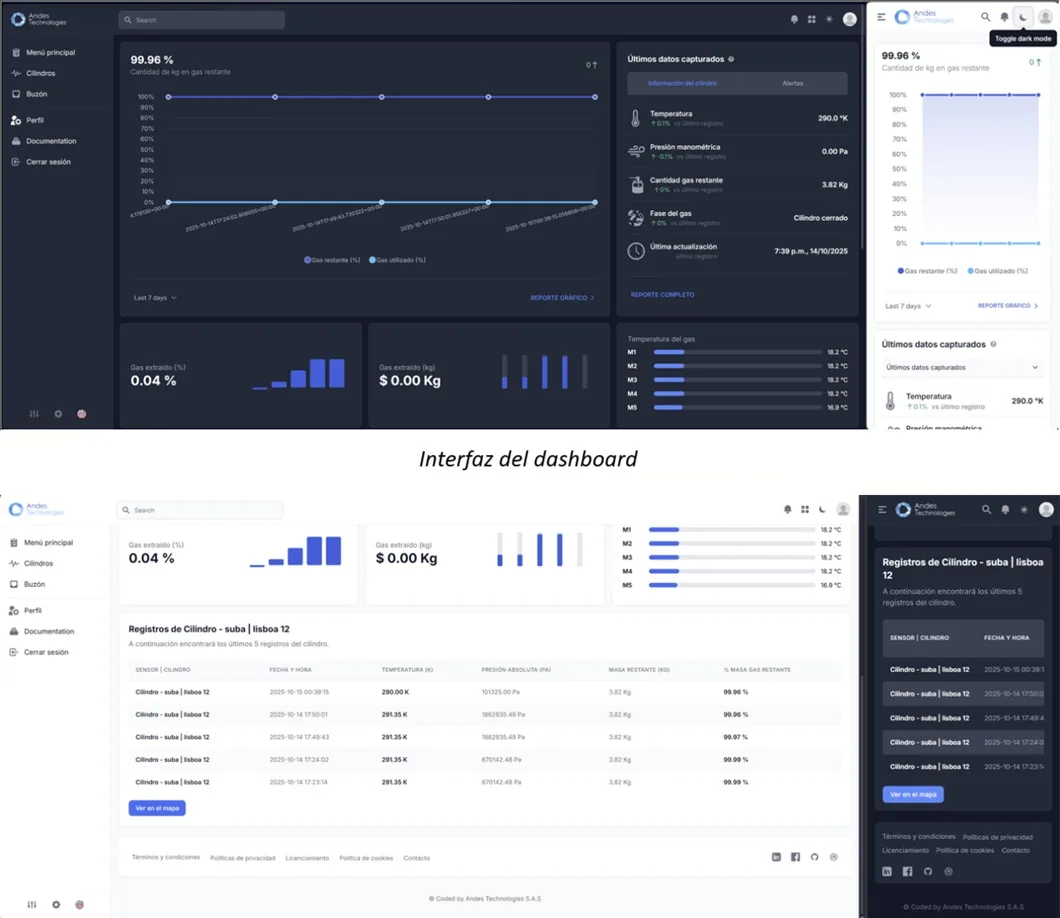
App design
To show the results of the previous phase, we developed a system that connects to the TP2401 IoT sensors through multiple APIs, processed the data, and showed the results on a dashboard. This dashboard allows monitoring variables such as pressure, temperature, flow rate, estimates of remaining gas, and real-time location.
Conclusions
The tests demonstrated that it is possible to determine with high precision the amount of gas leaving the cylinder using physical measurements and mathematical calculations, as long as it does not accumulate in the output valve or is not connected to an appliance. This is because the sensor can interpret that accumulated gas as if it were constantly flowing out.
In this scenario, the system can overestimate the gas output rate, causing errors in the calculations. Therefore, to improve precision, these types of sensors should be integrated directly into the appliances that consume the gas.
If you want to read more, click here →
02. Predicting "Vinho Verde" quality with Machine Learning
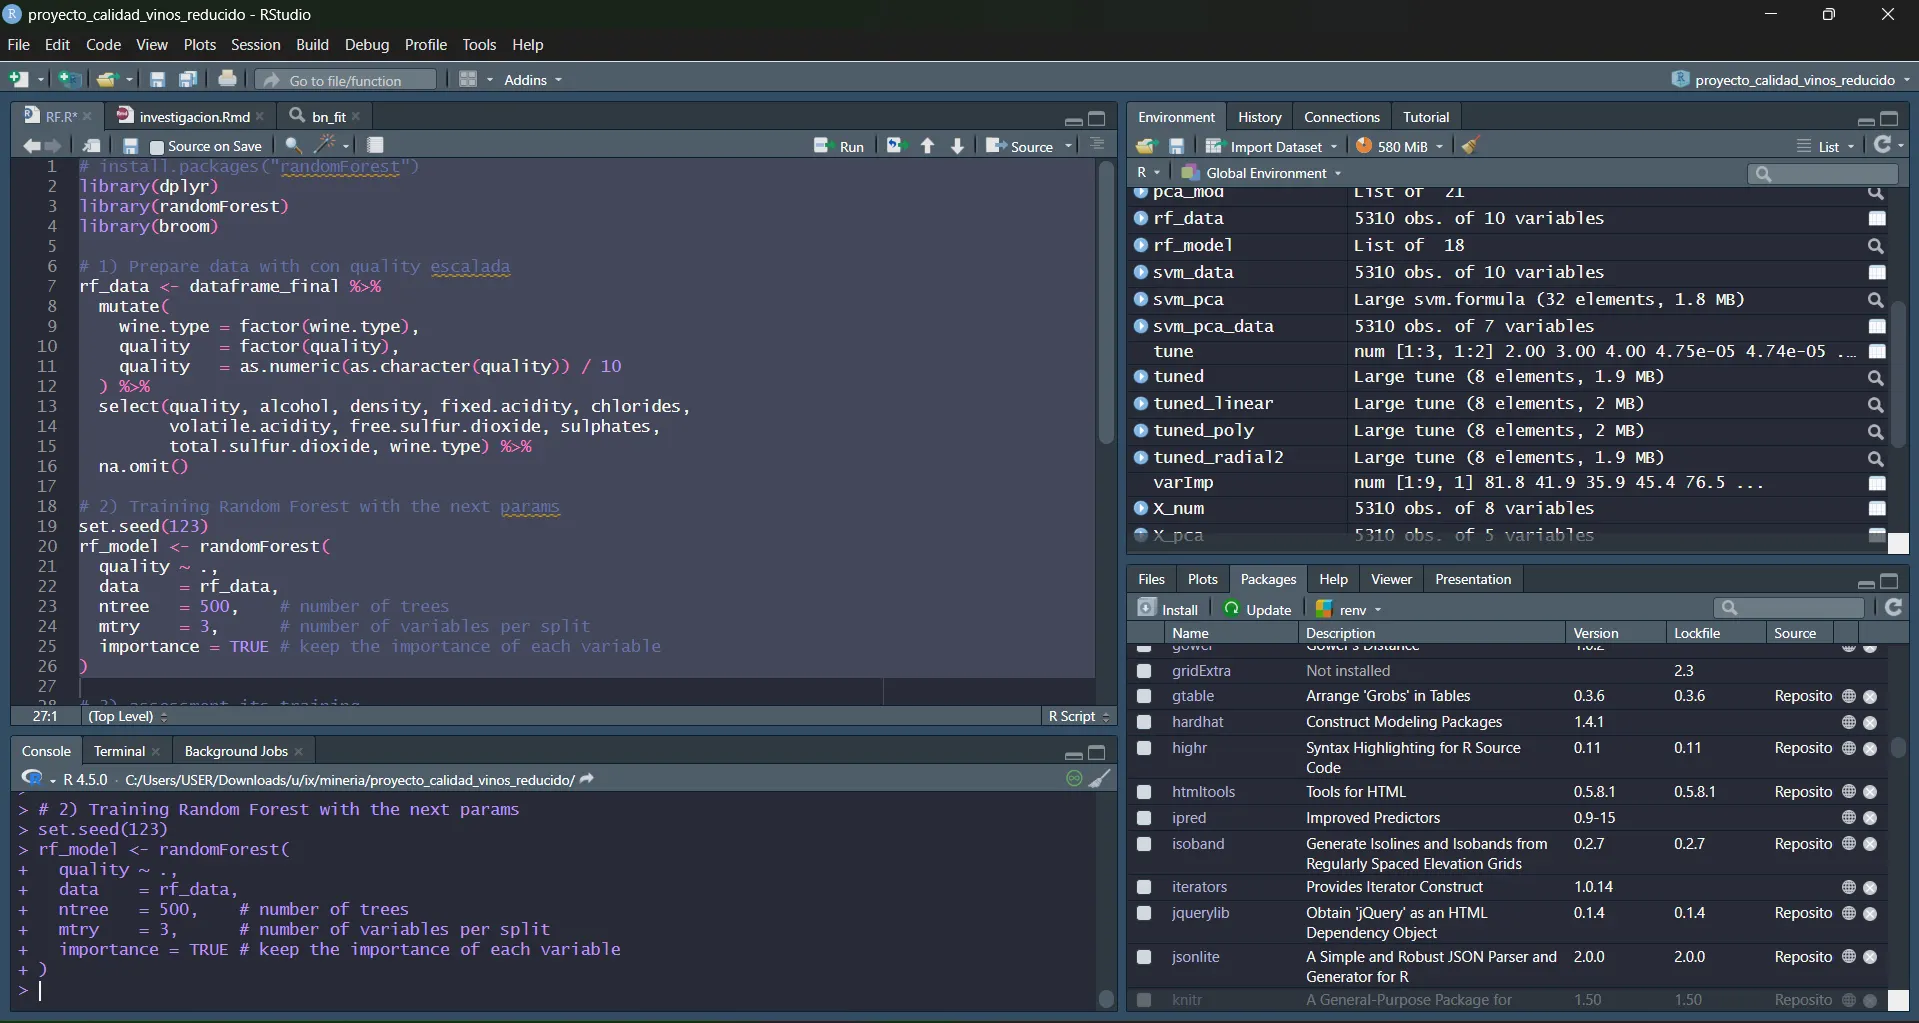
This was a university project that put my friends and me in a tough spot: we had only three months to develop a supervised Machine Learning algorithm in R. The first challenge to overcome was that none of us had used R before; so we had to learn as we went. What we did not know was that the challenge had a trap from the beginning.
1. The data challenge and non-linearity
The University of Minho in Portugal created a dataset in 2009 evaluating the quality of Vinho Verde in the northwest of the country. They took samples from local producers and sent them to laboratories for physicochemical tests. Then, the researchers created databases and models using probabilistic neural networks, using the multilayer perceptron technique and support vector machines. We did not know about the article until days after finishing the project, because the challenge set in class was to use linear regression to obtain a coefficient of determination (R²) not lower than 70%.
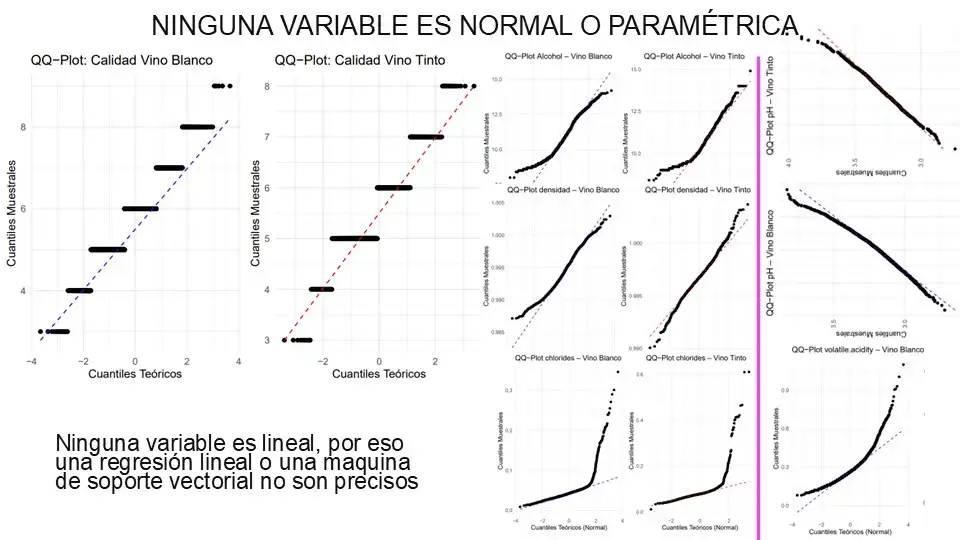
Before thinking about training the model, we did data mining to detect values that could damage the model. And then, through Spearman correlation, we evaluated how related the 20 variables were to quality. But when we saw the QQ Plots, we realized that no predictor variable followed a clear linear trend with respect to the target variable, quality.
2. Processing and normalization
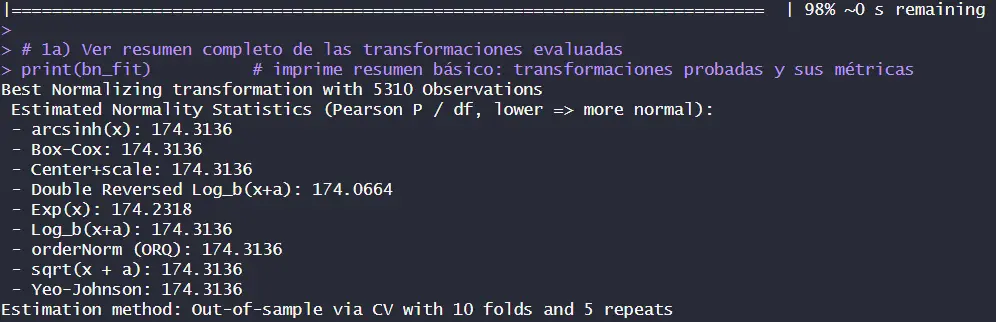
Our gut feeling was activated, but we could not go back; we had already been learning R for a month and still did not know the original paper. To reduce noise, we used the Anderson-Darling method. We chose 11 variables that continued to show non-parametric indices that did not follow a normal distribution. And to confirm once again that linear regression is not very viable, we used skewness and kurtosis plots to see how the tails made analysis impossible. Despite the evidence, we decided to continue with the regression because they were the teacher's instructions, and we thought she could not be wrong.
Then, we tried to normalize the 11 predictor variables so that the model would find linearity in 11 different dimensions using the bestNormalize library. However, no transformation was able to stabilize the data.
3. Model development
The final challenge
There were two weeks left to make a linear regression model predict wine quality with 70% precision. But after hours and hours of adjustments, we did not exceed 30.8%. There we discovered that 28% of that prediction was due only to alcohol; the other 10 variables together only contributed 2.8%. And the polynomial equation obtained was this:
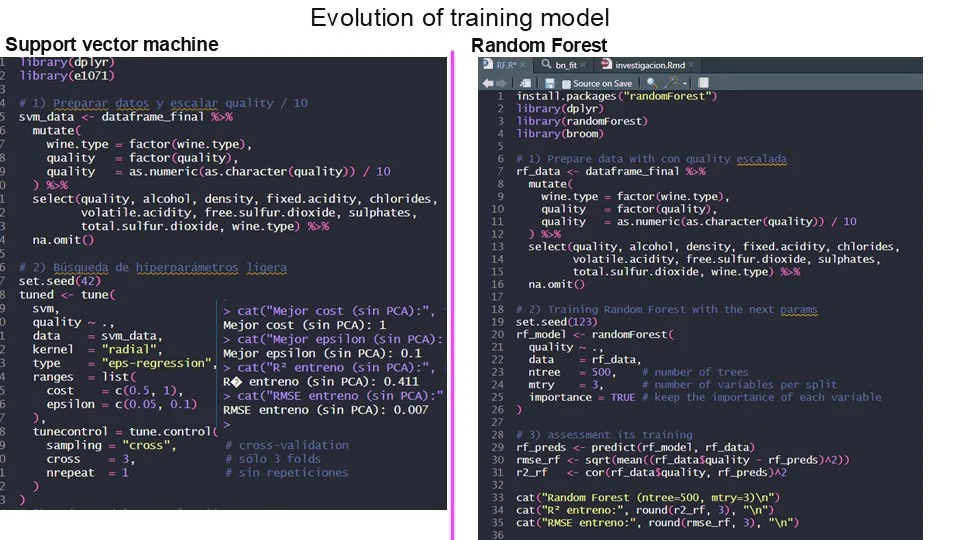
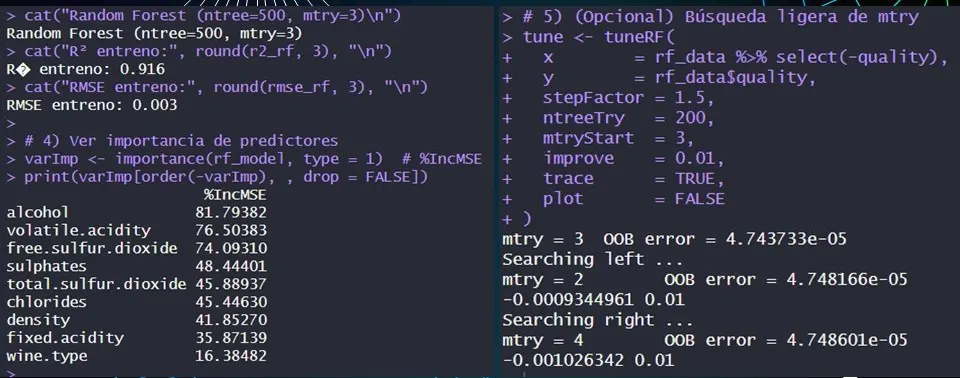
Just one day before submitting a model that failed miserably, a good friend from another group, John Valderrama, recommended that we use the random forest algorithm. And after studying and configuring it, we miraculously managed to predict 91.6% of the wine quality. We also tried support vector machines, which only reached 41.1%, perhaps because the original study by the University of Minho used absolute deviation and we were looking for the coefficient of determination.
4. Evaluation and Results: Reaching 91.6% precision
- The analysis revealed that for every 1% increase in alcohol content, the quality of the wine increases by 0.305 points on average (controlled by the other variables). And along with its result in the Anderson-Darling test, alcohol has a positive and real impact on the quality of the vinho. So now you know: the more alcohol, the tastier your vinho will be.
- The model identified which components influence the most; the first-degree polynomial detailed above has the variables ordered from highest to lowest according to their impact on perceived quality.
- Last but not least: without the support of my friends I would not have been able to finish this project. This was possible because Carlos Mahecha and Sebastián Ramírez did everything necessary to make the project work.
Explore the repository and detailed research →
03. DevOps Architecture, CI/CD and load balancing in Azure
This project was born from a need to learn Docker. At Christmas 2024 and early 2025, my head only thought about: I need to learn Docker to implement it in my thesis, so I was taking courses on Platzi. Since the courses were so new, I ended up being the first comment in every class. The funny thing is that, to this day, there are still people liking or thanking me for those contributions. That community inspired me to share everything I know and to contribute to the software community.
The challenge was to leave the web apps ready to send to production with just a few clicks, and for that the containers had to be lightweight and scalable using the multi-stage technique. I integrated it with GitHub to create a CI/CD flow that covers everything from image optimization to cloud orchestration, using GitHub Actions, Nginx and Microsoft Azure.
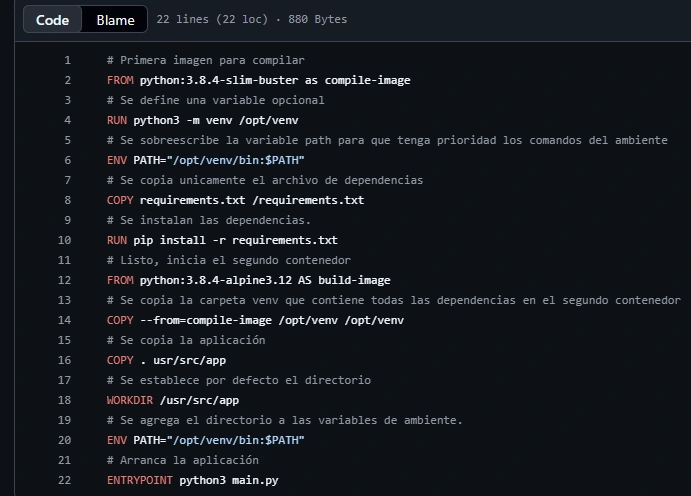
1. Container strategies for production
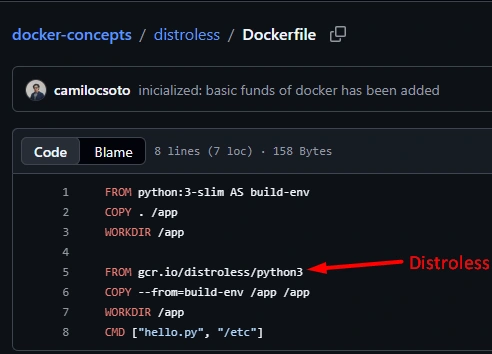
In production, a container must be lightweight and secure. You cannot upload heavy and vulnerable images. Therefore, I implemented two strategies according to what the service needed:
Multi-stage container construction
It is very useful when the container needs to compile heavy dependencies to build the image, and then we move the final binaries to an ultra-lightweight image. This way, the production server does not carry unnecessary junk.
Distroless images
I used this for a Docker that only needed to show a static web app. By removing the operating system, package managers, and an active terminal that could be insecure, it removes a large amount of weight and greatly reduces the attack surface and resource consumption.
2. Automation with CI/CD in GitHub Actions
To make internet deployments easier, I configured .yml files so that Continuous Integration and Deployment pipelines automate that. The idea is simple: I do git push and the deployment happens by itself.
Every time I upload changes to the repository, GitHub Actions wakes up, builds the optimized images, and pushes them to DockerHub to register artifacts and to Azure to update.
3. High availability and load balancing
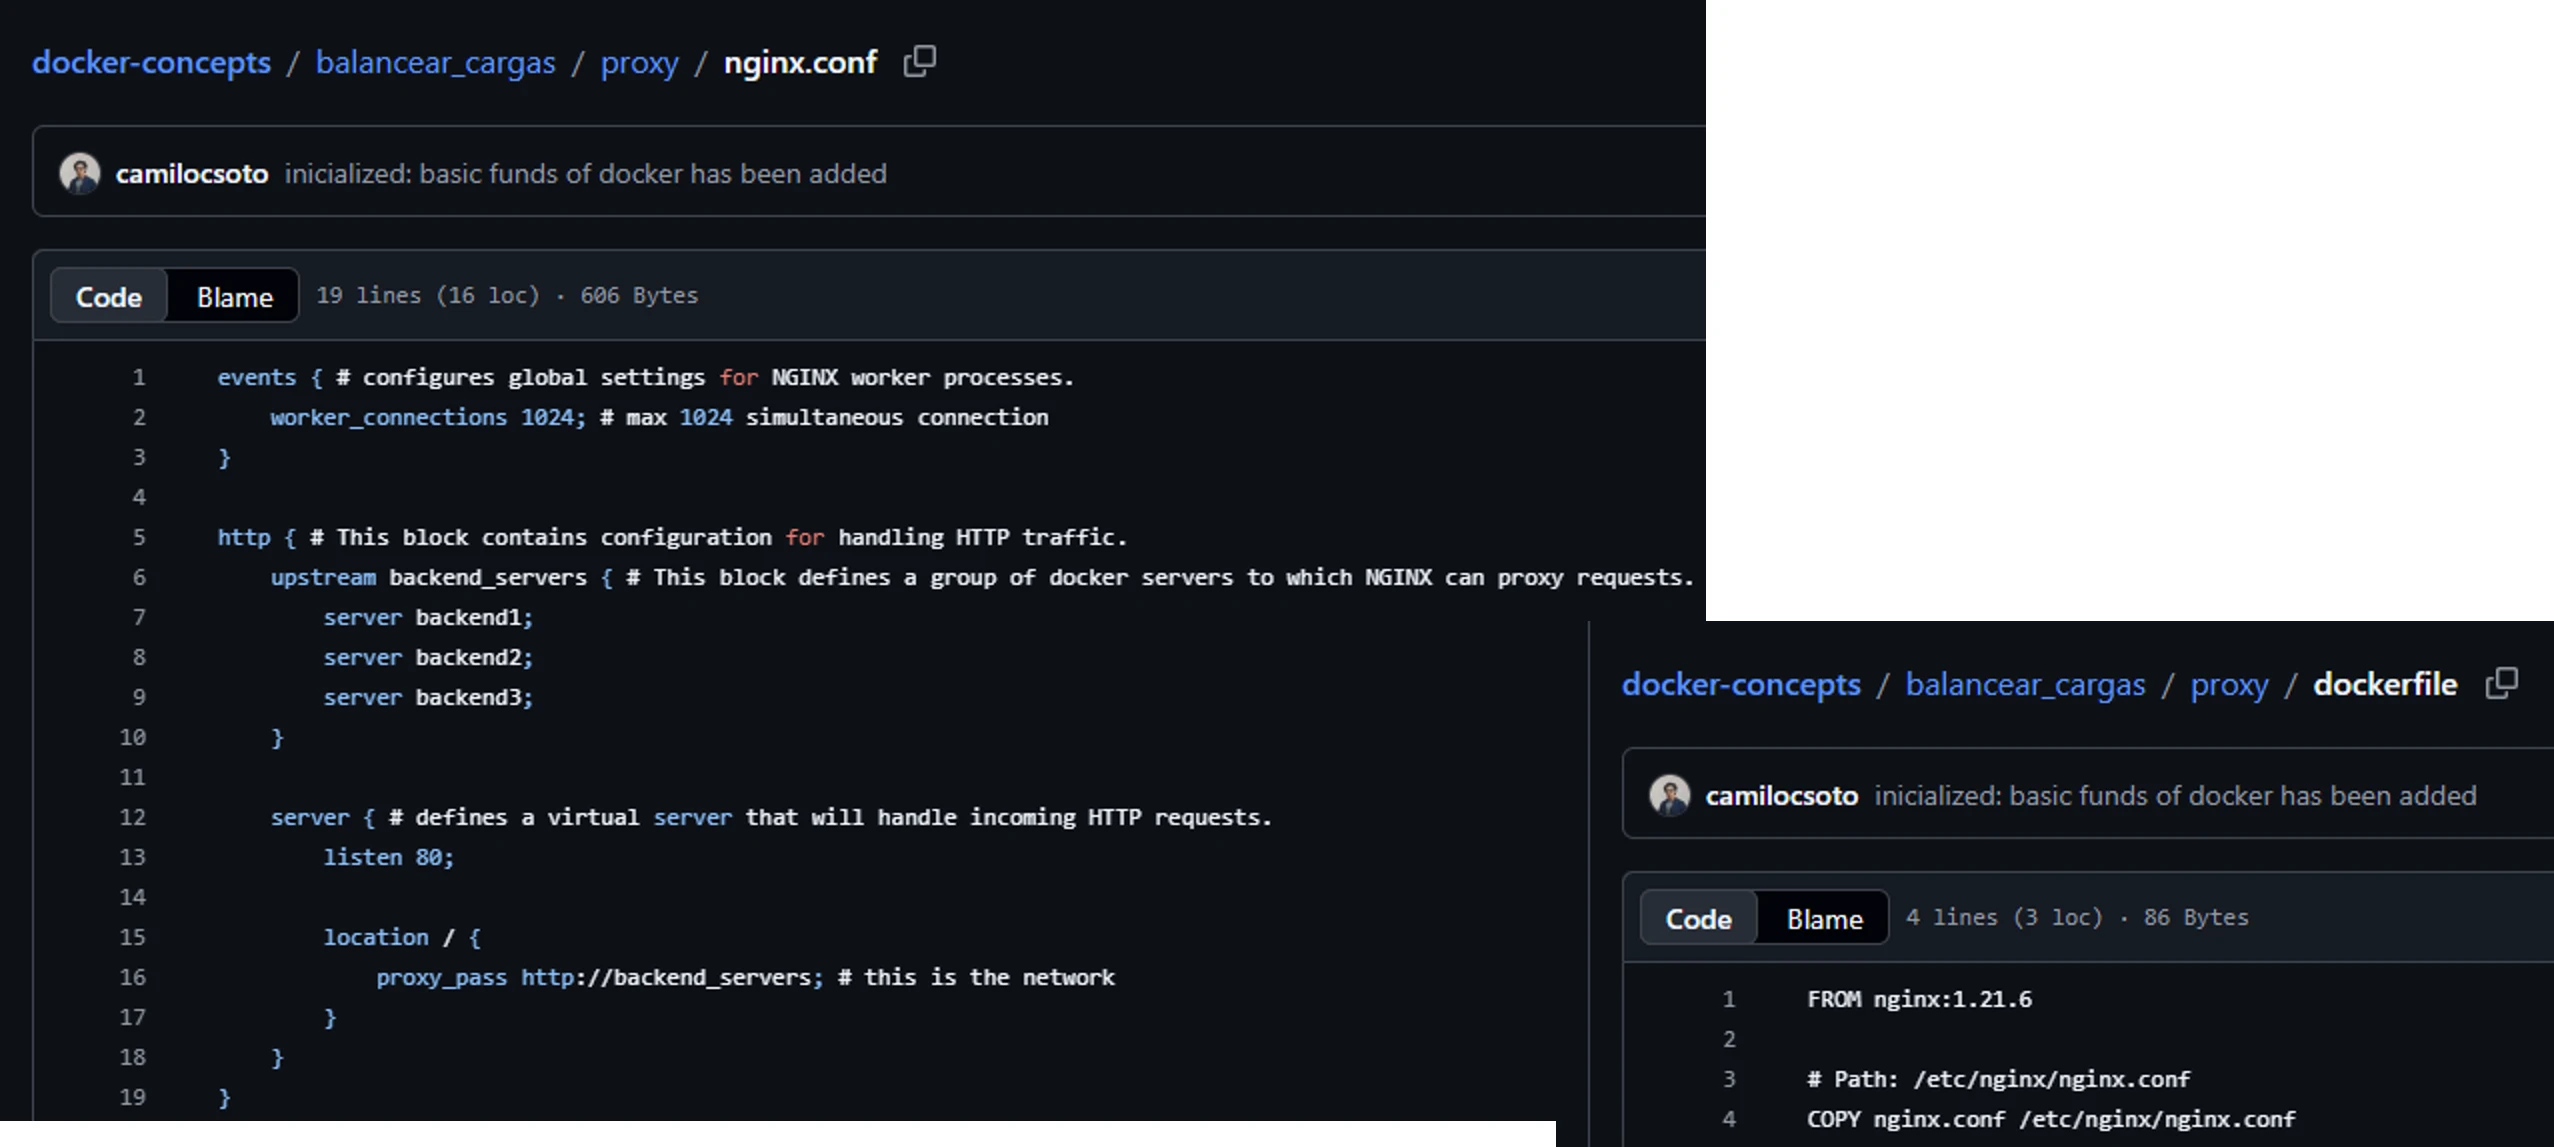
And finally, I made my own load balancer and configured it with Nginx acting as a reverse proxy to understand how Kubernetes works, although I have not learned to use k8s yet.
To achieve this, instead of using a single server, I left several containers exposed with the same content, and the nginx.conf file distributes the traffic among all the web containers. If one crashes due to the number of requests, the other three continue responding without the user noticing anything at all.
4. Final deployment in the cloud
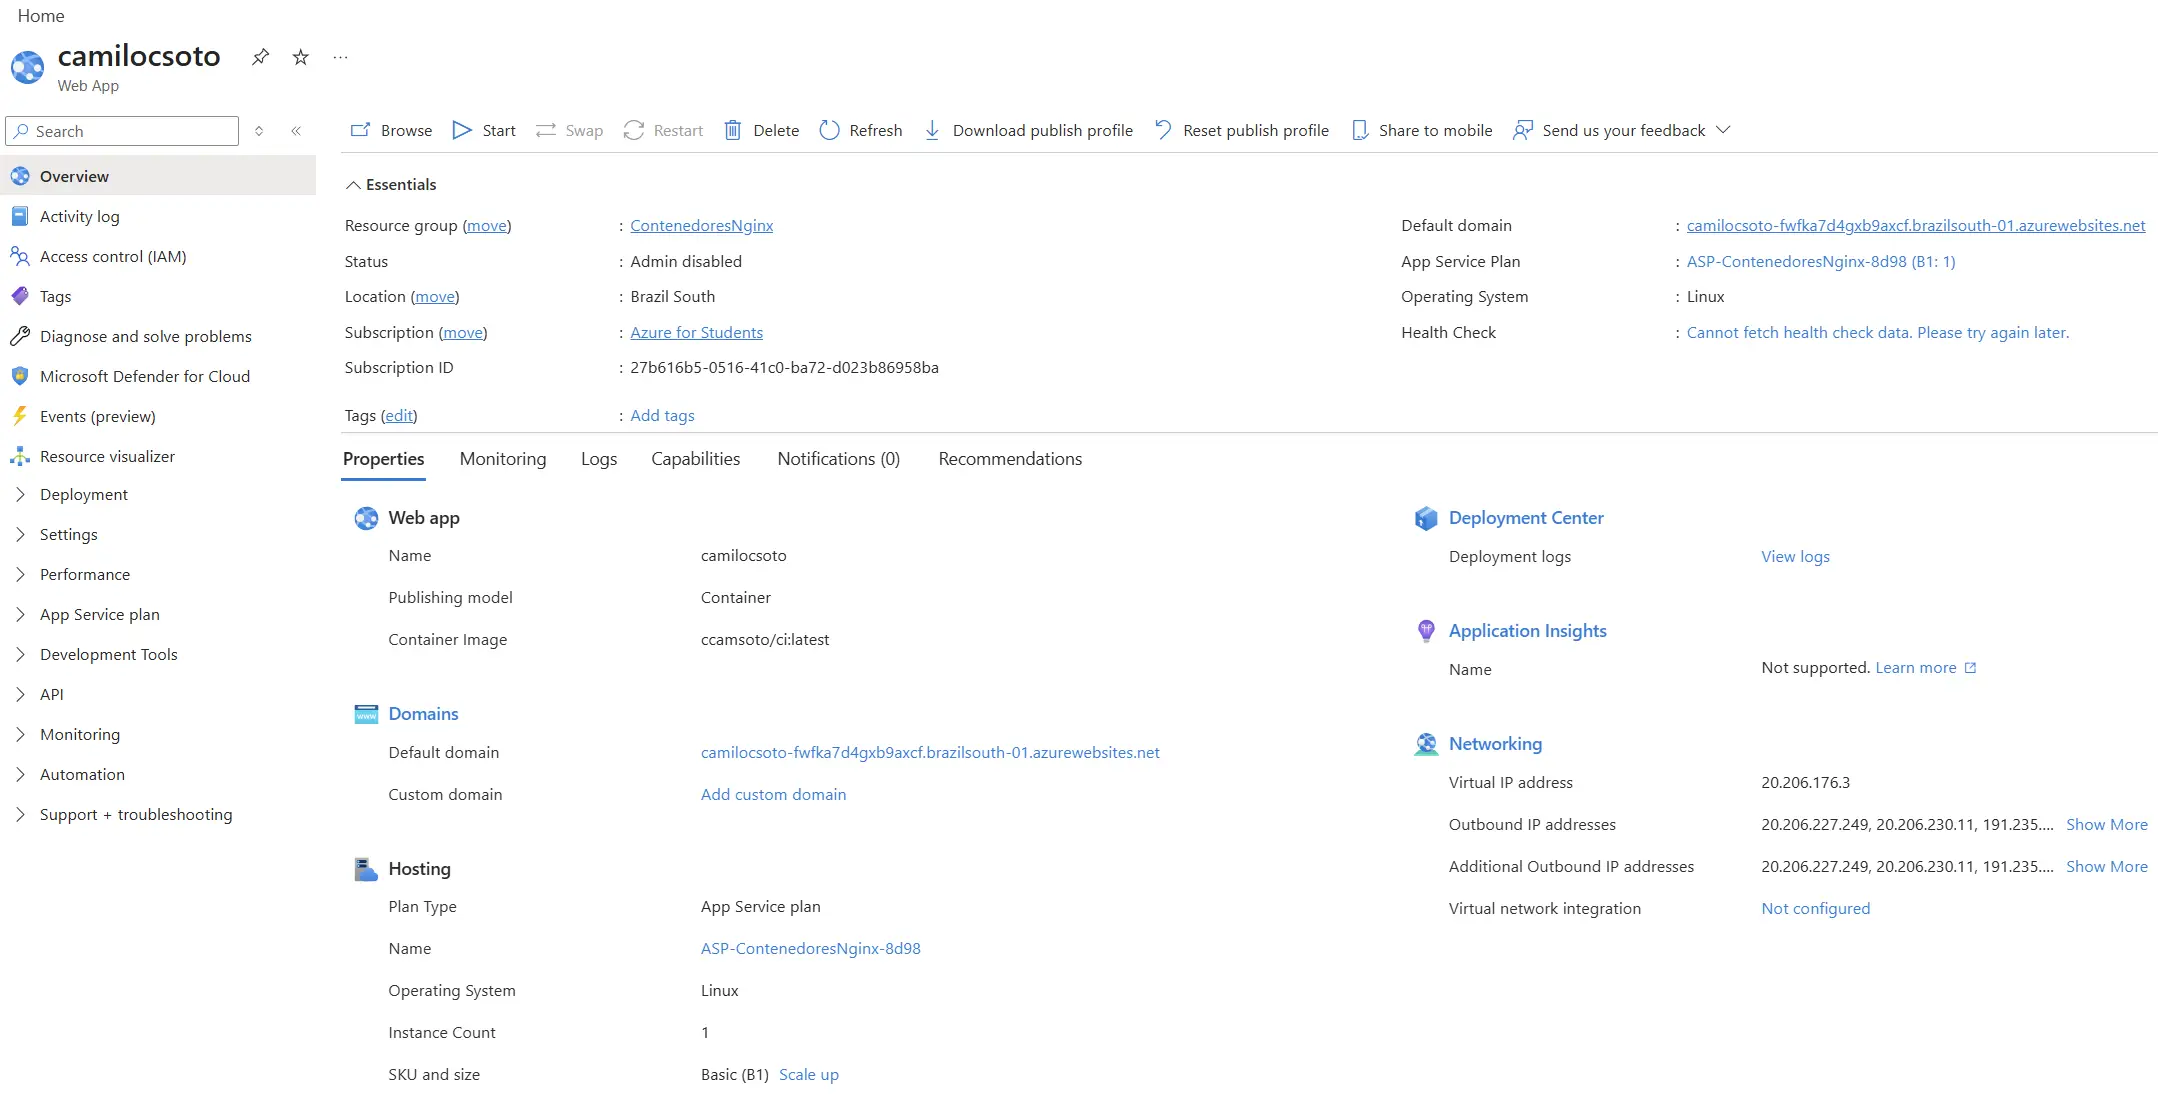
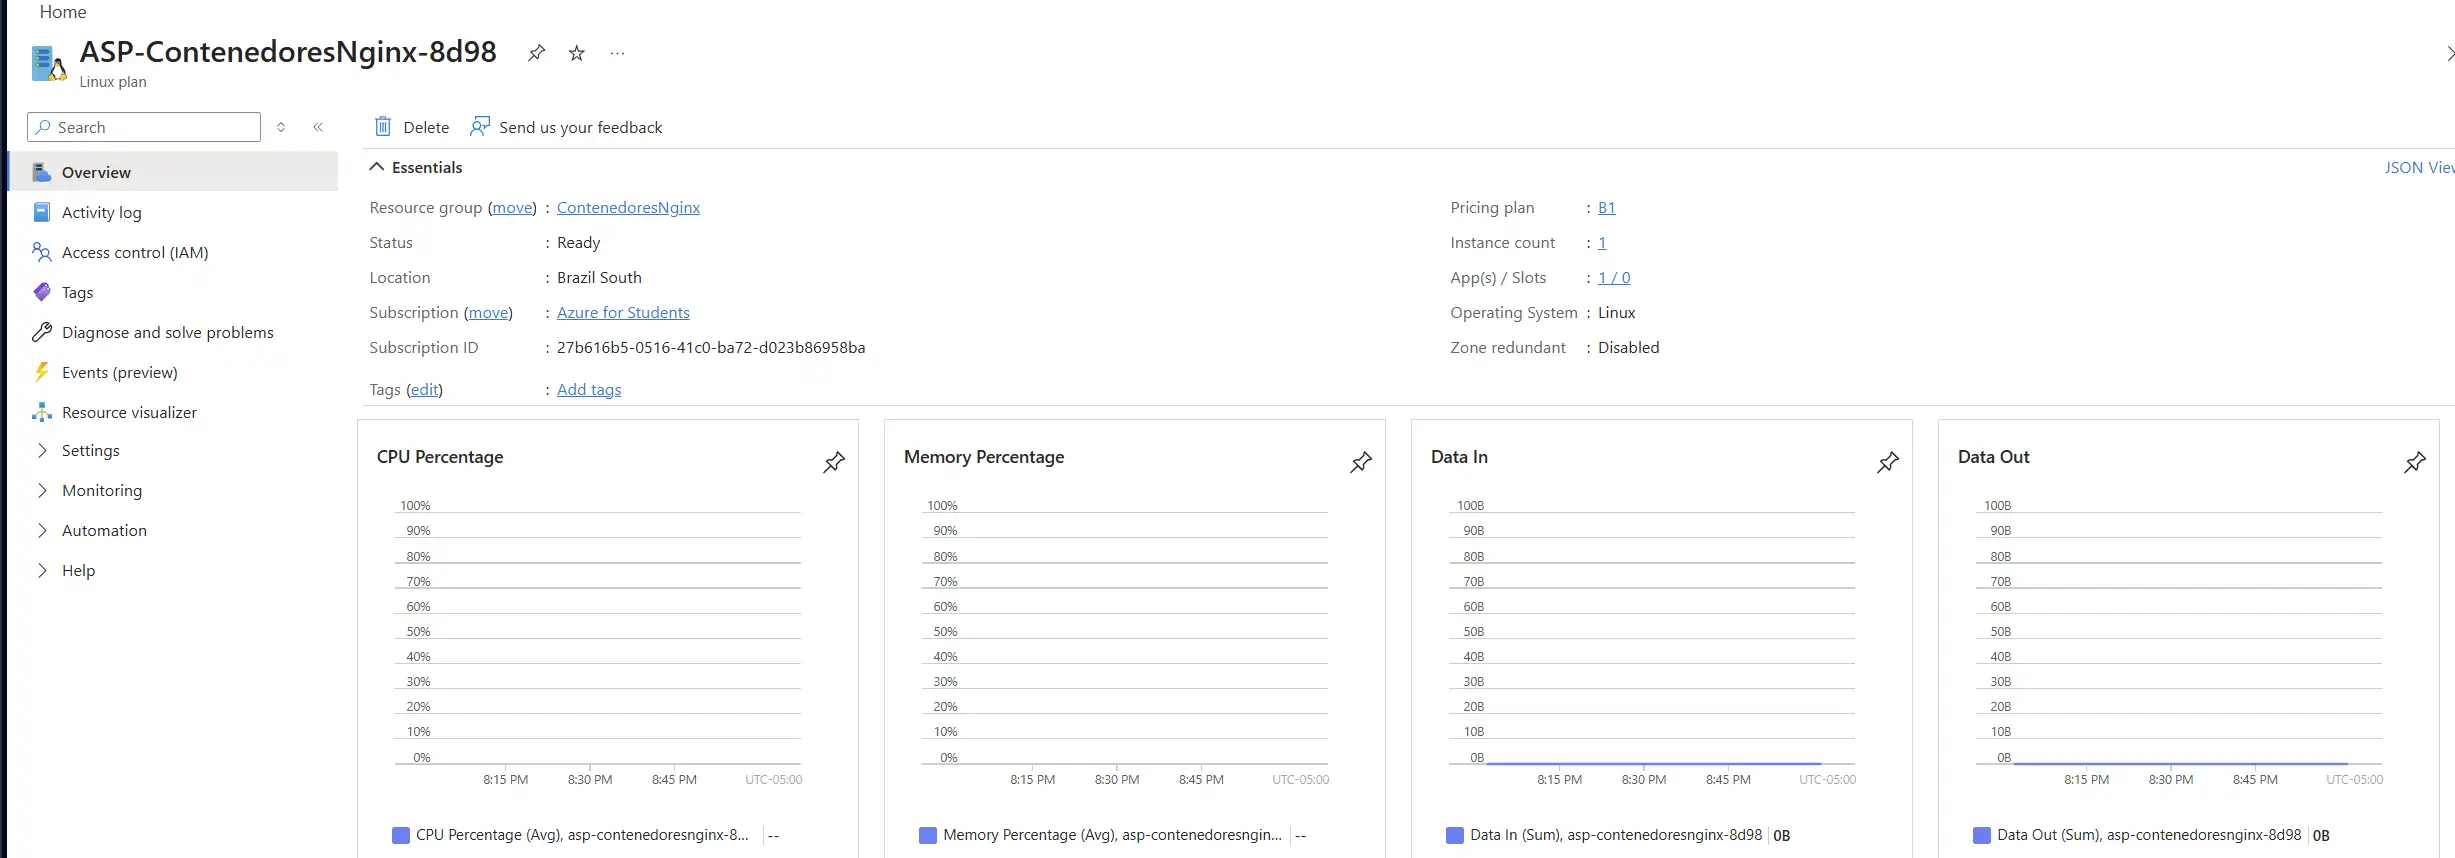
I deployed the entire load balancer in Azure web services, including the main service and the internal network that communicates the containers. However, I later had to turn it off because I ran out of all my credits and keeping the service active ends up being a bit expensive.
If you want to see the Dockerfiles and configuration files, check my GitHub here →